
zabbix is open-source and can monitor infinite hosts and show many graphs and stats
1. Create zabbix docker network
docker create network zabbix-network
2. Install Postgres Database for Zabbix
docker run -d --name zabbix-postgres --network zabbix-network -e POSTGRES_USER=bob -e POSTGRES_PASSWORD=some-passwd -e POSTGRES_DB=zabbix -p 5432:5432 postgres:15
POSTGRES_USER=bob
POSTGRES_PASSWORD=some-passwd
POSTGRES_DB=databasename
3. Install Zabbix Server
docker run --name zabbix-server --network zabbix-network --link zabbix-postgres -e DB_SERVER_HOST="zabbix-postgres" -e POSTGRES_USER="bob" -e POSTGRES_PASSWORD="some-passwd" -p 10051:10051 --init -d zabbix/zabbix-server-pgsql:latest
4. Install the Zabbix Web Gui
docker run --name zabbix-web --network zabbix-network --link zabbix-server -p 8085:8080 -e DB_SERVER_HOST="zabbix-postgres" -e POSTGRES_USER="bob" -e POSTGRES_PASSWORD="some-passwd" -e ZBX_SERVER_HOST="zabbix-server" -d zabbix/zabbix-web-apache-pgsql:latest
5. Access Web-Gui and set Admin Passwd
go to http://192.168.X.X:8085
login with standard username and password
user: Admin
passwd: zabbix
go to Users -> Users and change passwd

so the server is up and running now continue to add hosts by installing „ZABBIX-AGENTS“ on different devices you want to monitor
6. install Zabbix Agent on hosts you want to monitor
docker run --name zabbix-agent -e ZBX_ALLOWED_HOSTS="0.0.0.0" -e ZBX_SERVER_HOST=192.168.X.X -e ZBX_SERVER_PORT=10051 -e ZBX_HOSTNAME="some-server-hostname" -p 10050:10050 -d zabbix/zabbix-agent:latest
ZBX_SERVER_HOST=“ip of the zabbix-server previosly installed“
ZBX_HOSTNAME=“hostanme-of-the-host-you-want-to-monitor“ (this is important you need this to find and add agent in zabbix-server-web-gui)
to add connected harddrive for the graph to discover mount it with read only (ro)
-v /media/256GBSSD:/media/256GBSSD:ro
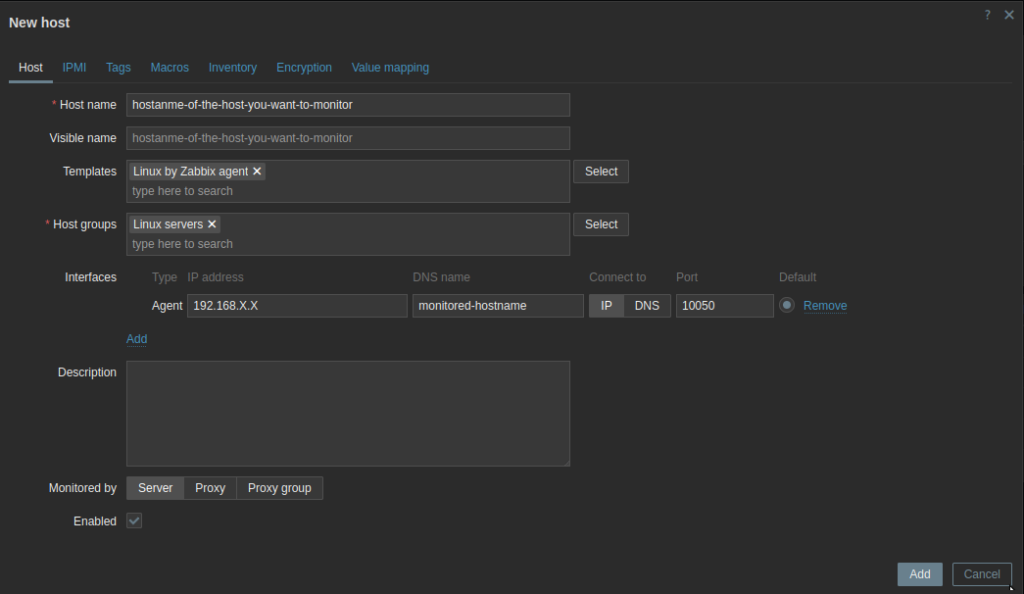
7. Add Agent to Zabbix-Server-Gui
go to „Data collection“ -> „Hosts“ -> right upper corner „Create host“

then set:
Hostname: „hostanme-of-the-host-you-want-to-monitor“
Templates: „Linux by Zabbix agent“
Host groups: „Linux servers“
Interfaces -> Add -> Agent: 192.168.X.X -> Dns name -> monitored-hostname -> port: 10050
click Add and your first host is done.
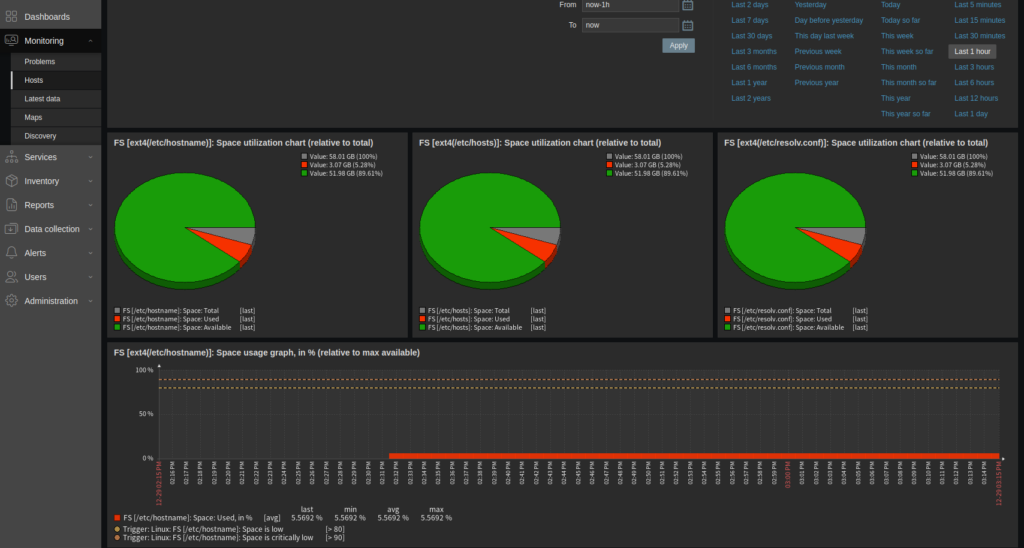
ZABBIX is very Scalable.. start find some Monitoring Stats.. too much to cover everything and all available Templates
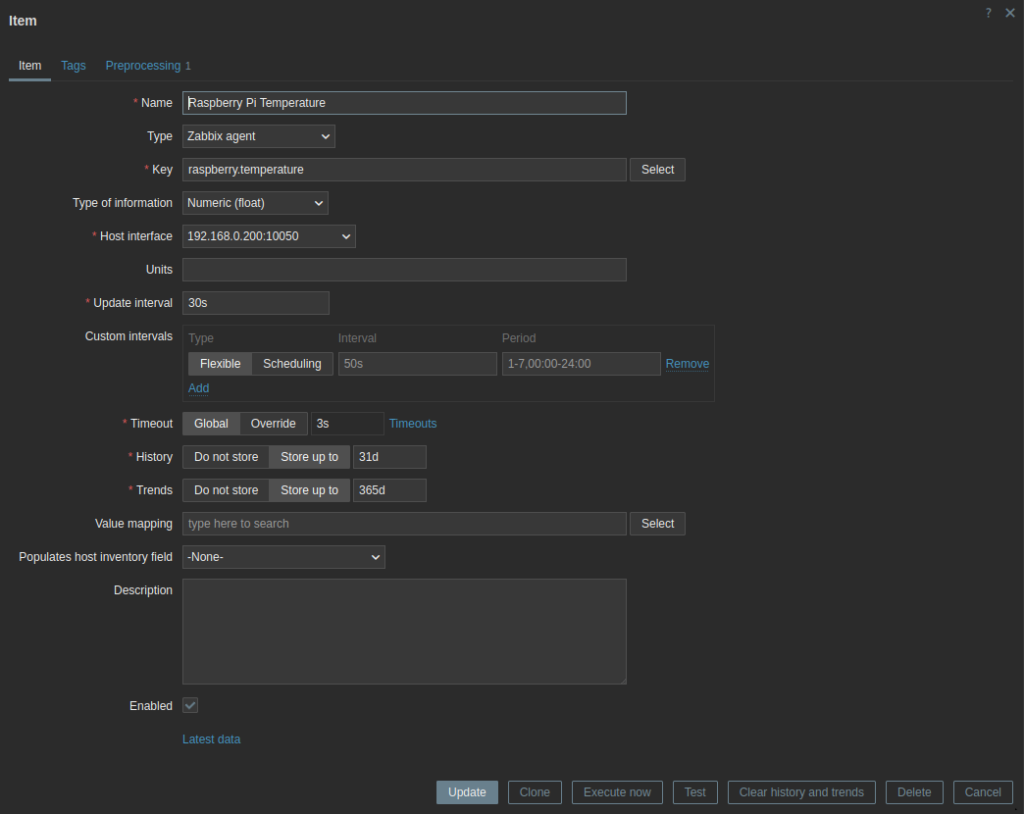
8. Add custom Item like temperature
If you want to monitor Temperature on Raspberry Pi add following conf file to agent contaiener
docker exec -it zabbix-agent sh -c "echo 'UserParameter=raspberry.temperature,cat /sys/class/thermal/thermal_zone0/temp' > /etc/zabbix/zabbix_agentd.d/raspberry.conf"
then test if its work:
docker exec -it zabbix-agent zabbix_agentd -t raspberry.temperature
should output something like this:
„raspberry.temperature [t|43550]“ means 43 degrees
restart Agent and Add Item as shown below in „Data colection“ -> „Hosts“ -> „Items“
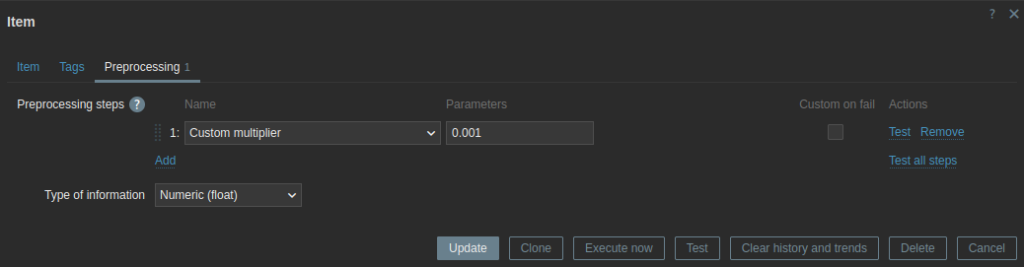
and in tab „Preprocessing“ add multiplier to cut value for huaman readable
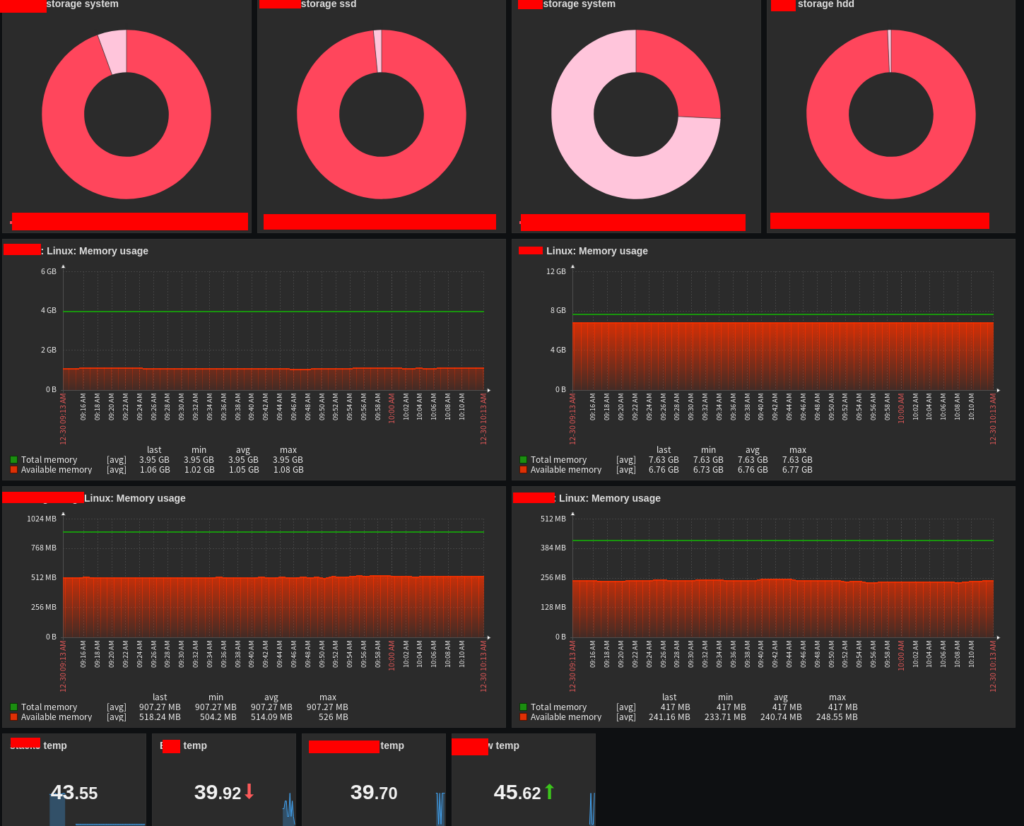
then you can Add a widget on Dashboard
Schreibe einen Kommentar
Du musst angemeldet sein, um einen Kommentar abzugeben.